 Documentation
Controller web interface and user access
English reference for opening the controller web interface, managing access and finding device controls.
Overview
The built-in Wiren Board web interface handles most configuration tasks for the controller, its software and connected devices. The interface is open source. It is served by nginx and communicates with MQTT through WebSocket.
Some outdated operating systems and browsers may not display it correctly. If problems occur, the manufacturer recommends checking operation in Google Chrome.
Opening the web interface
Connect to the controller over Wi-Fi or Ethernet and enter its IP address in a browser. On the same network, Linux, Windows 10 or later, macOS and Apple devices can also use mDNS: enter http://wirenboard-XXXXXXXX.local, replacing XXXXXXXX with the controller serial number.
To establish HTTPS, the interface redirects to a hostname of the form IP.XXXXXXXX.ip.wirenboard.com. Access is also possible through Wiren Board Cloud if the controller is connected to it.
Connection security
The web interface uses HTTPS. Opening the controller over HTTP, by IP address or local hostname, redirects to the corresponding IP.XXXXXXXX.ip.wirenboard.com hostname and establishes a secure connection. This is still a direct connection to your controller; traffic does not pass through a third-party service. With a proxy or custom routing, ensure the hostname is reachable by the same route as the original IP address.
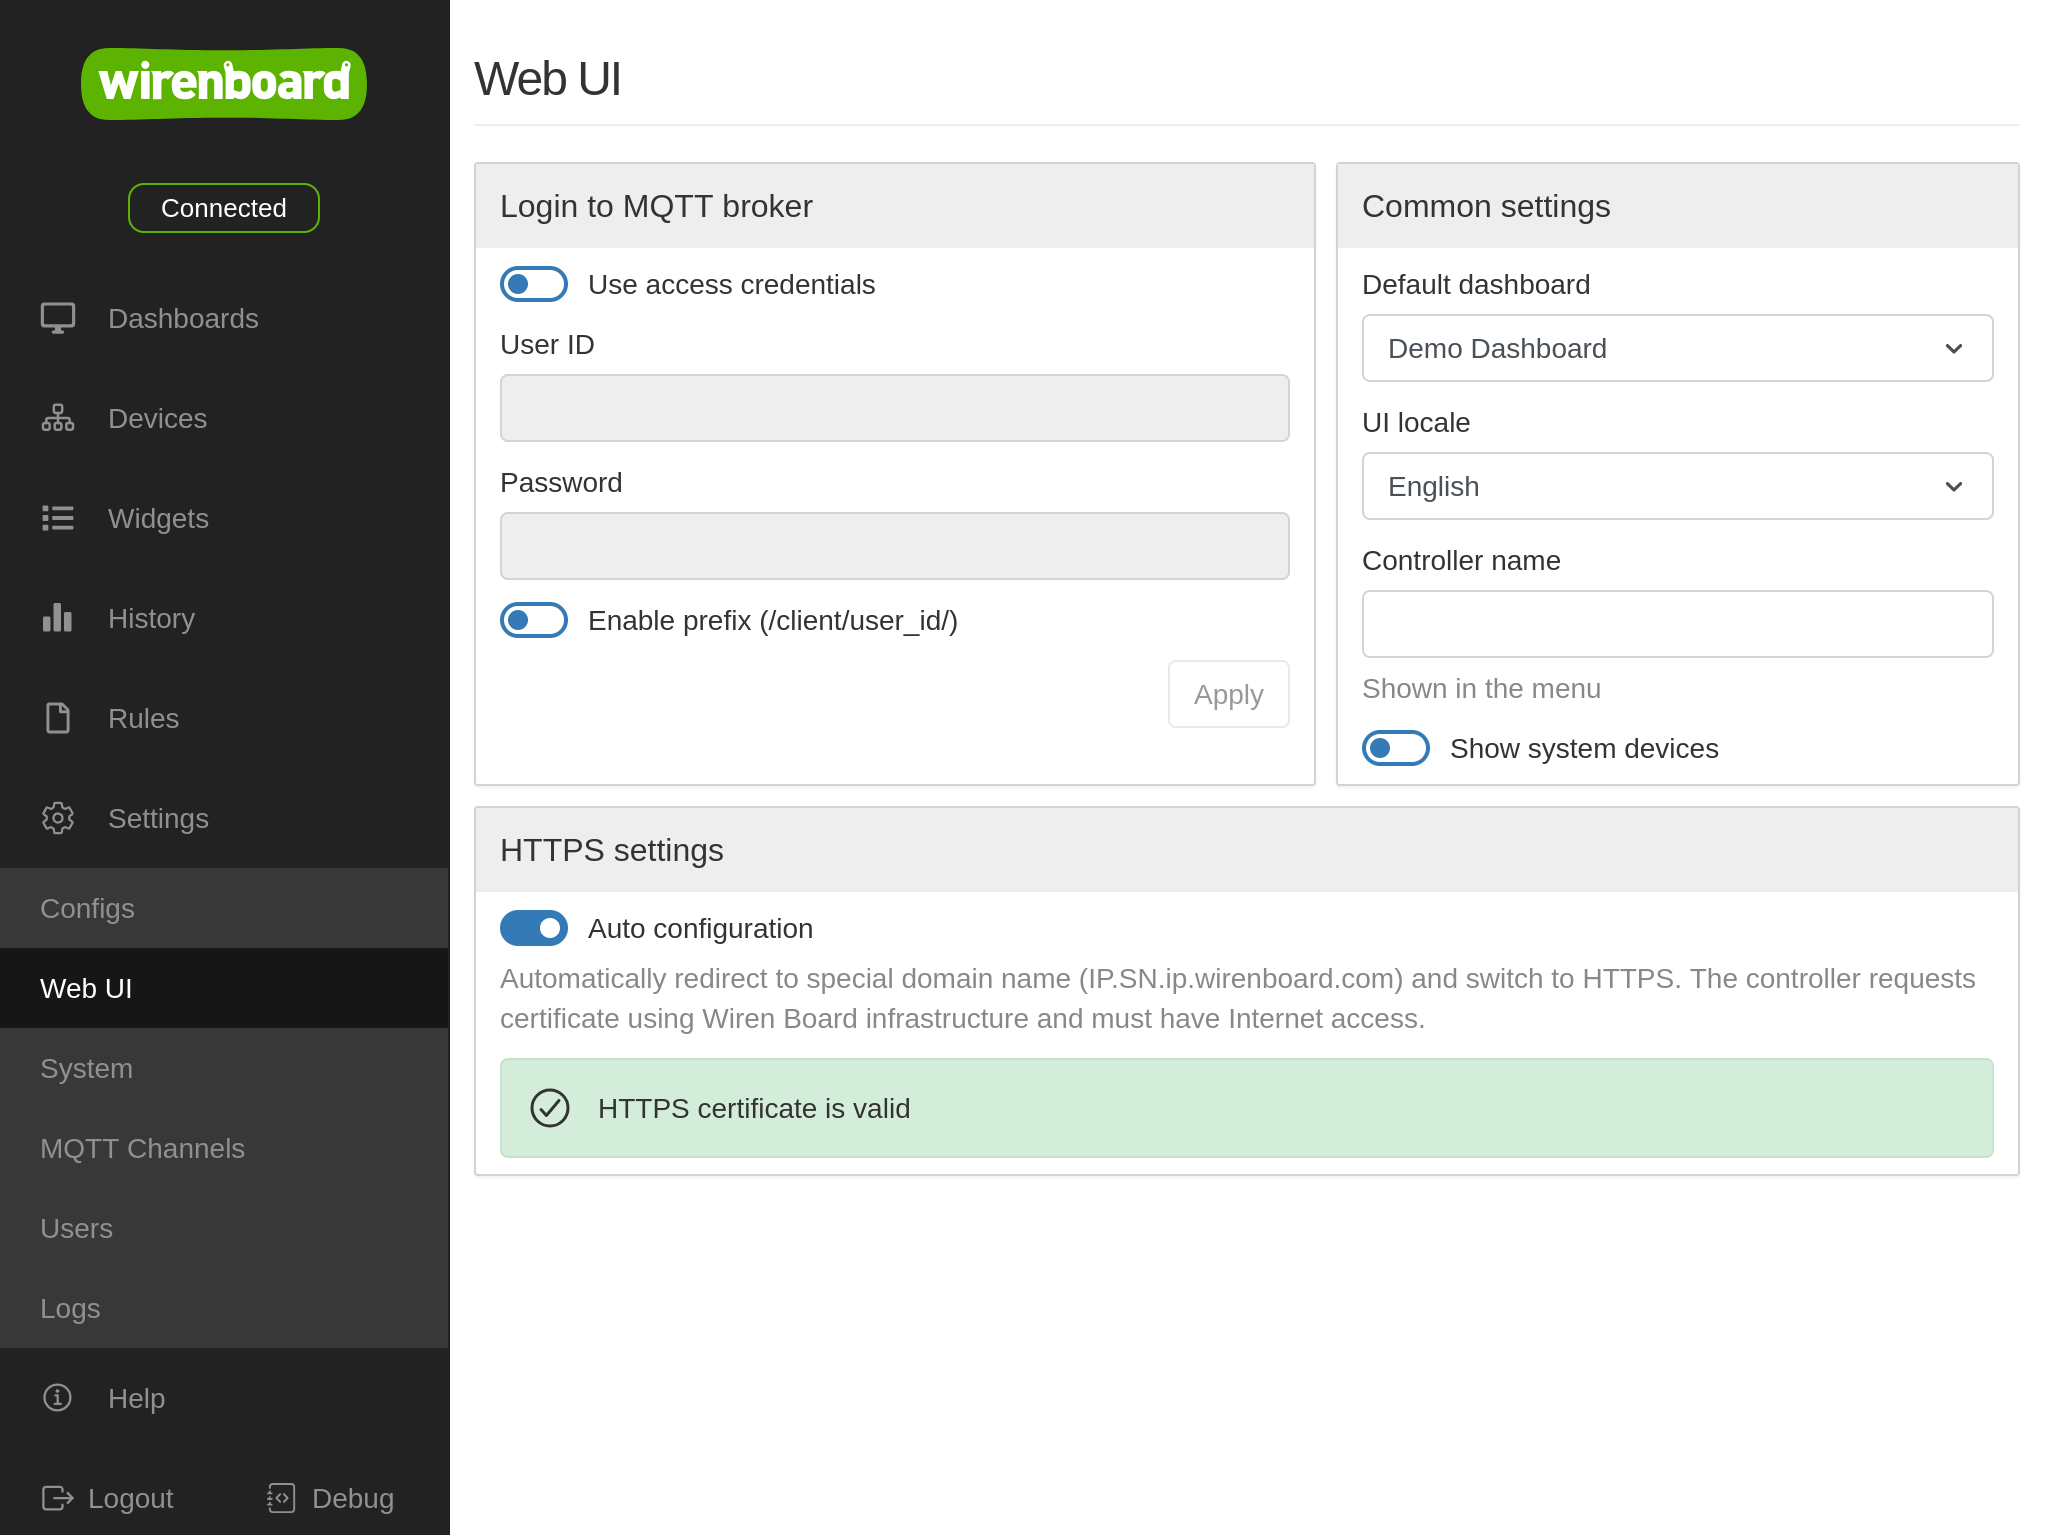
The controller automatically requests a Let’s Encrypt certificate through acme.wirenboard.com. Issuing and renewing it requires Internet access. The controller manages renewal; if the certificate expires and renewal fails, the browser displays a warning.
Certificate issuance is visible in public services. The certificate does not disclose the owner's identity or the controller's location, and its publication does not enable unauthorized access. The automatic HTTPS mechanism can be disabled or re-enabled in the interface settings.
User authentication and authorization
The interface supports three access levels:
| Role | Allowed actions | Restrictions |
|---|---|---|
| User | View dashboards and history, access MQTT and request port-availability checks. | Cannot change settings, upload or update firmware, or download diagnostic archives and backups. |
| Operator | All User permissions, plus creating and editing dashboards. | Cannot change controller settings or manage users. |
| Admin | Full access to settings, rules, user management, firmware updates and archive downloads. | No restrictions. |
On first startup, the controller opens the interface with Admin permissions without requesting credentials. To require authentication, create users on the user-settings page. Authentication uses a login and password, and the same browser does not require credentials to be re-entered every time. You can also choose a user whose permissions apply when opening the interface without signing in.
User accounts can also be managed with the wb-homeui-users command-line utility.
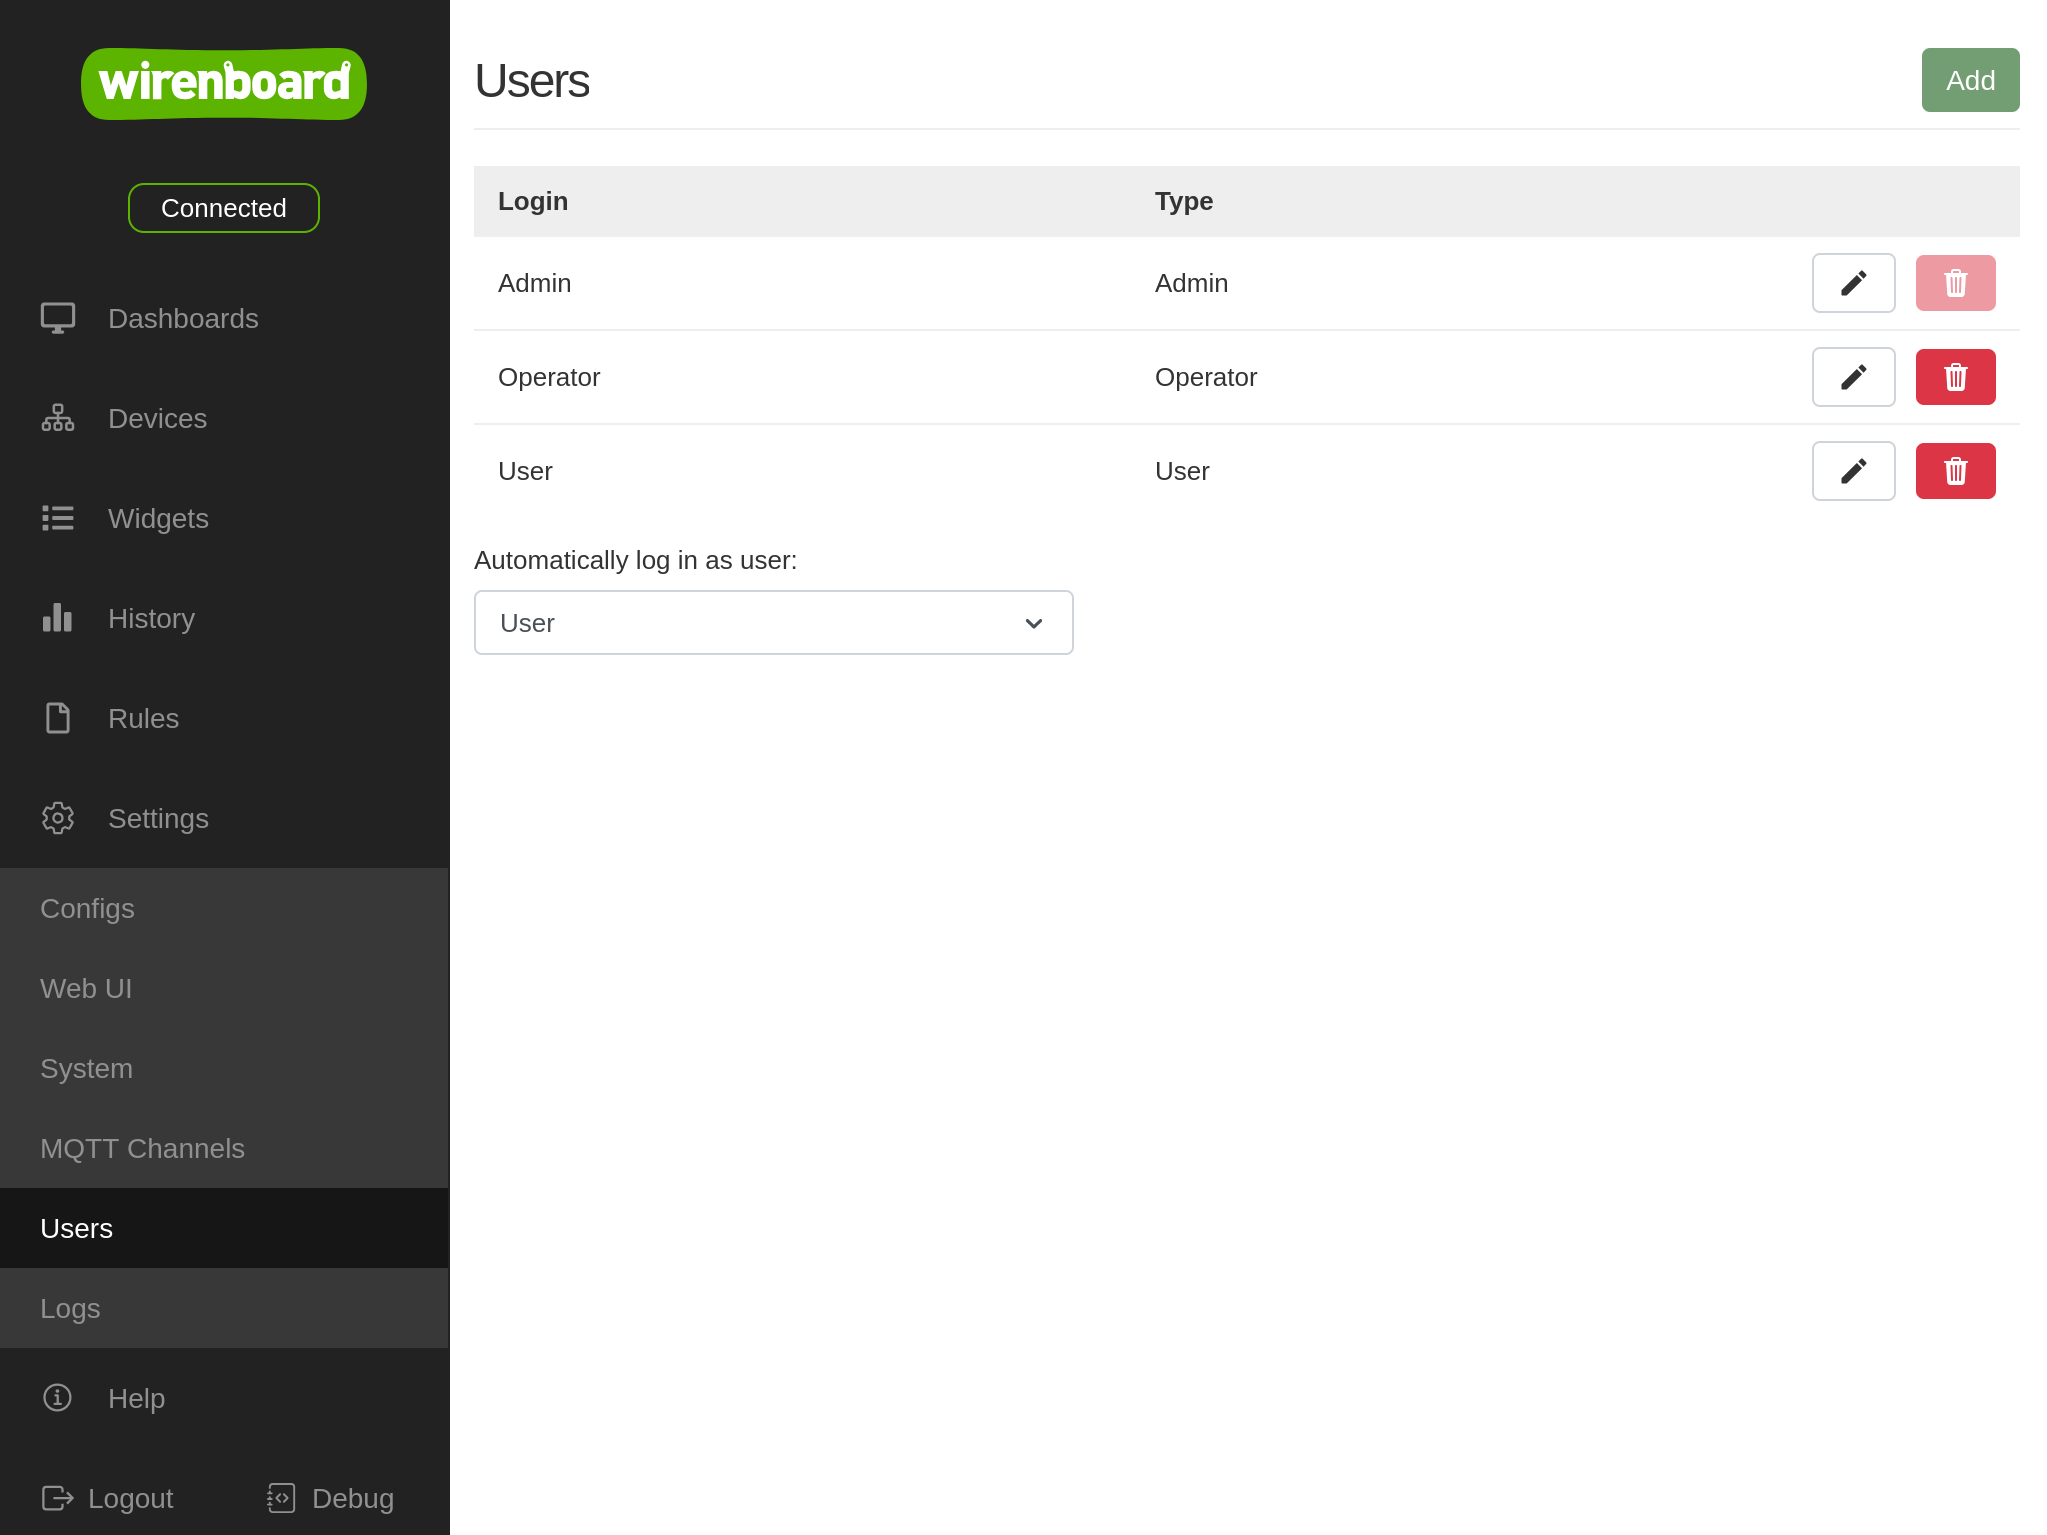
Releases before wb-2602 did not support user-account authorization in the web interface. Those releases can use nginx HTTP authentication.
Devices and controls
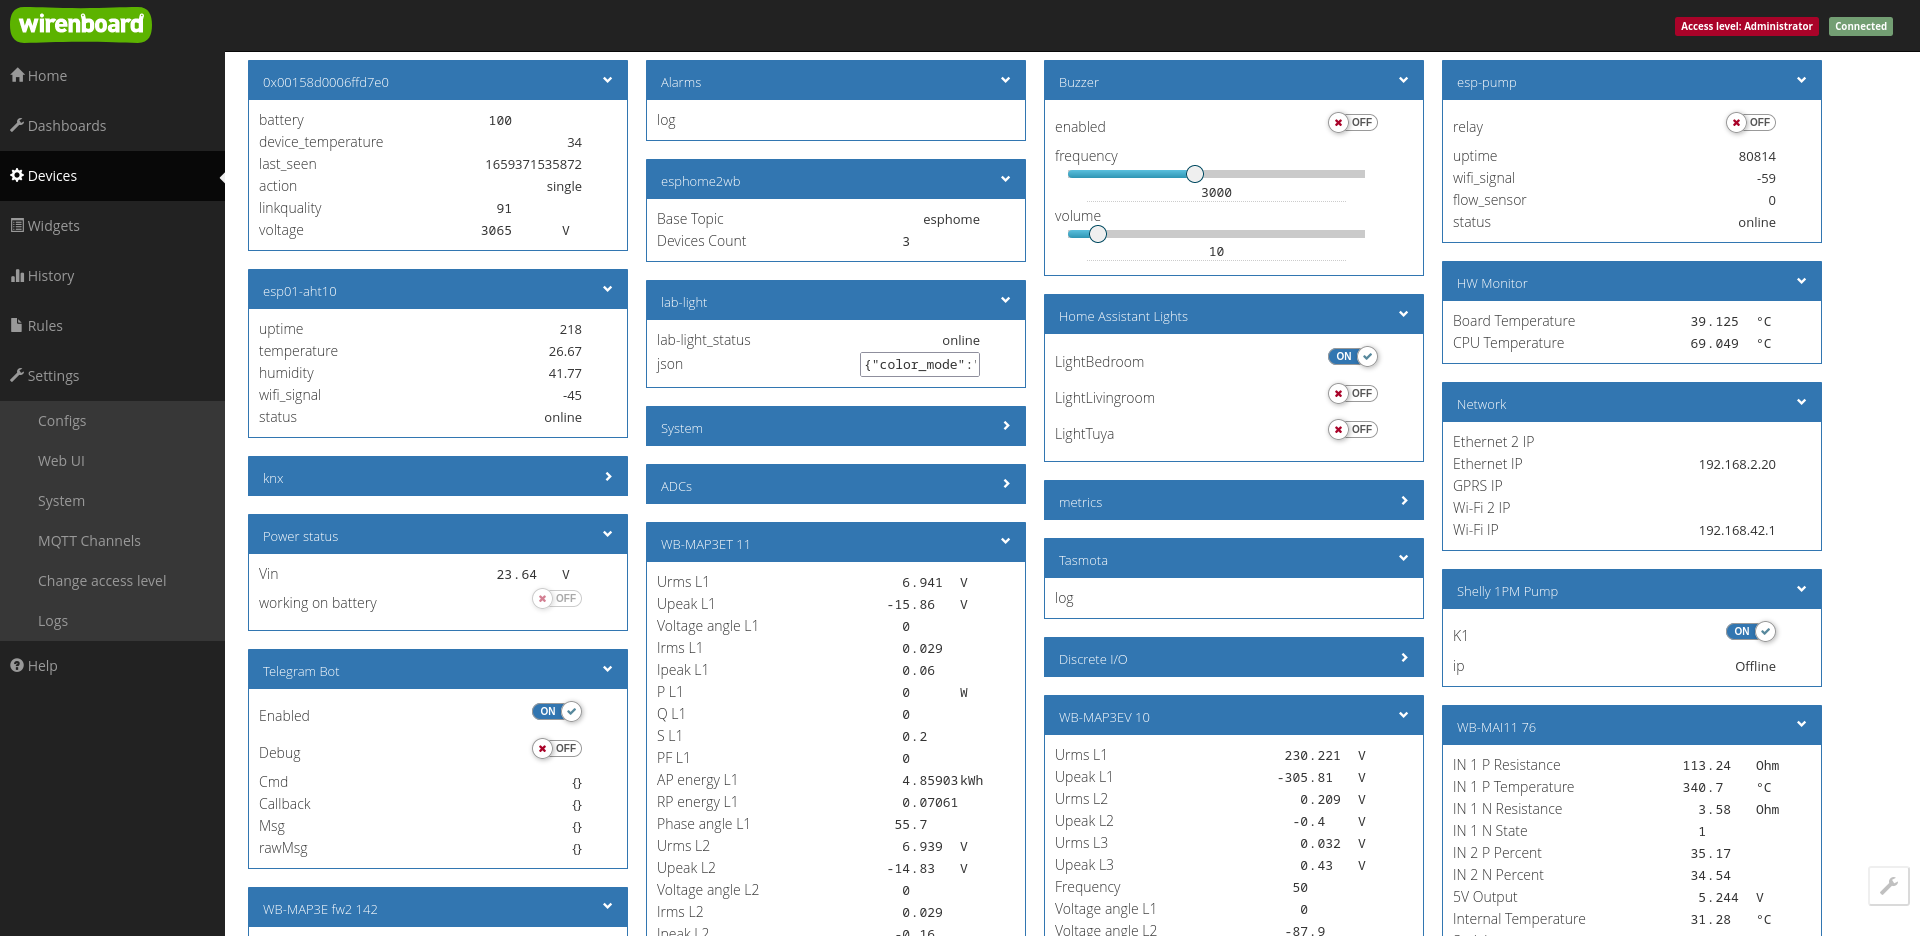
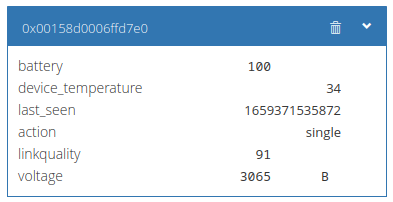
The Devices page shows representations of physical devices connected to the controller and virtual devices created by wb-rules. Each device has a card containing its channels, called controls. Click a control's name to obtain a device/control path for use in rules.
Use dashboards for operating the automation system; the Devices page is intended for working with individual devices. System widgets also show system information, network details, processor and board temperatures, and other service data.
Changing the access level
Your access level is determined by the user account you sign in with. Authentication uses a login and password. An Admin account is required to change controller settings. Manage accounts under Settings → Users.
Releases before wb-2602 do not have user accounts; their access level is selected under Settings → Access level.
MQTT connection and interface language
Under Settings → Web UI, you can configure the MQTT broker connection, select the dashboard used as the home page and change the interface language.
Time synchronization (NTP)
The NTP configuration editor under Settings → Configs configures the system time service by editing /etc/ntp.conf.
The controller has a hardware real-time clock (RTC), but needs periodic synchronization with reference time sources. Accurate time is required for meaningful diagnostic log timestamps, scheduled automation and HTTPS/SSL certificate validation.
Working with the configuration
Public time servers (pool.ntp.org) are configured by default. Changes are normally needed in two cases:
- In an isolated network without Internet access, remove external servers and enter the IP address of a local time source, such as a router or corporate server.
- Where the installation requires corporate NTP servers, configure those sources to use the same time reference throughout the infrastructure.
Parameters
You can add, edit and remove time sources. Supported synchronization modes are:
pool— recommended for Internet sources. Similar toserver, but accepts a DNS pool name, such aspool.ntp.org, representing multiple servers.server— client mode. The controller synchronizes with a remote server or local reference clock; that server does not synchronize with the controller.peer— symmetric active mode. Either node can synchronize with the other. This can be useful in a cluster where faults may change which node has the best time source.broadcast— a local server periodically sends time messages to a broadcast or multicast address, typically for many clients on a local network.manycastclient— client mode with automatic discovery. The client sends to a multicast address; available servers reply, and it selects the best synchronization sources.
Specify the source's DNS name or IP address. The iburst option sends a burst of eight packets when the server is unavailable, allowing faster synchronization when connectivity returns or after reboot. It applies to server entries.
Dashboards and widgets
Dashboards
Create text and graphical SVG dashboards to display values and operate the automation system. A text dashboard consists of widgets. An SVG dashboard uses a background image with bindings to the controller's MQTT channels.
Widgets
Widgets group controls from different devices by function or location. For example, a widget can control bedroom lighting or show a shop's climate controls. Widgets are arranged in dashboards, and one widget can belong to several dashboards.
Create widgets on the Widgets page or directly from a dashboard. Both a visual builder and a JSON editor are available.
Rules debugging console
The debugging console shows diagnostic messages while developing and testing rules. Open Debug → Rules in the lower-left corner of the interface. You can filter messages by type and resize or reposition the console.
Built-in terminal
The testing release provides a full Bash terminal with colour and tab-completion support. Open Debug → Console to use the command line directly from the web interface. The terminal is available only to Admin users.
Full-screen and HMI modes
The normal interface includes navigation and status information that are not always needed for everyday operation. Alternative layouts reduce this interface furniture to suit the display and task.
Full-screen mode
Full-screen mode is convenient for viewing dashboards on a phone and for building dashboards. The dashboard list and History remain available, while the top bar is hidden. This is useful for complex installations with several dashboards and historical data analysis.
Open a dashboard and use its full-screen button in the upper-right corner. The browser's own title bar is separate from the web interface: to hide it automatically at startup, use the browser's kiosk mode.
Operator workstation
The operator-workstation layout resembles full-screen mode but has no button for leaving it. Combined with browser kiosk mode, it can provide an operator display without normal access to other applications or the address bar.
Add ?fullscreen to the dashboard URL:
# Text dashboard
http://192.168.2.108/#!/dashboards/dashboard1?fullscreen
# SVG dashboard
http://192.168.2.108/#!/dashboards/svg/view/dashboard3?fullscreen
HMI mode
For a tablet or touchscreen, HMI mode hides the left navigation and top connection-status bar. Add ?hmi to the URL, where dashboard1 is the text-dashboard ID and dashboard3 is the SVG-dashboard ID:
http://192.168.2.108/#!/dashboards/dashboard1?hmi
http://192.168.2.108/#!/dashboards/svg/view/dashboard3?hmi
Use hmicolor to set a background colour. For example, %23abcdef is the URL-encoded hexadecimal colour #abcdef:
http://192.168.2.108/#!/dashboards/dashboard1?hmi&hmicolor=%23abcdef
http://192.168.2.108/#!/dashboards/svg/view/dashboard3?hmi&hmicolor=%23abcdef
To hide the browser's title bar at startup as well, use browser kiosk mode.
Browser kiosk mode
Kiosk mode provides a full-screen browser without the usual user controls for leaving it. It is useful for an operator workstation: start the browser automatically in kiosk mode to display the control panel without normal window controls.
- Open the controller web interface.
- Copy the dashboard URL from the address bar.
- On Windows or Linux computers and tablets, start the browser in kiosk mode and pass that URL:
firefox -kiosk 'http://wirenboard-ascmdm6q.local/#!/dashboards/dashboard1'
chromium -kiosk 'http://wirenboard-ascmdm6q.local/#!/dashboards/dashboard1'
On Android tablets, use a dedicated kiosk browser such as Fully Kiosk Browser. Browser kiosk mode can be combined with either full-screen or HMI mode.
Data history
By default, the controller software stores received data and displays it as graphs or tables. Export CSV using the button below the graph or the wb-mqtt-db-cli utility.
Open History and select the required channels, or hover over a widget control and click its graph icon. The view supports selecting a time range, displaying several channels together, zooming, taking a screenshot, displaying the stored values and their delta range, and cursor measurements. For additional capabilities, configure automatic export to Grafana.
How history works
The wb-mqtt-db service writes data to the database. Configure it under Settings → Configs using the MQTT data-history configuration.
Channels are arranged in groups, each with a channel list and recording rules. Channel patterns use DEVICE_NAME/CONTROL_NAME; + means all, so +/+ matches every channel of every device and wb-w1/+ matches every channel of wb-w1. The default group is all with pattern +/+.
A channel belongs to only the first matching group. Multiple groups cannot give one channel several storage resolutions, such as second-by-second values for the last hour and minute-by-minute values for the last week.
Group parameters
| Setting | Key in /etc/wb-mqtt-db.conf | Default | Meaning |
|---|---|---|---|
| Maximum records per channel | values | 10000 | The maximum records retained for each channel in the group. Oldest records are deleted when exceeded. |
| Maximum records per group | values_total | 100000 | The maximum combined records for all channels in the group; limits database size. |
| Recording interval for changing values (s) | min_interval | 120 | How often changing values are recorded. |
| Recording interval for unchanged values (s) | min_unchanged_interval | 1200 | How often an unchanged value is recorded as a reference point. |
| Maximum burst records | max_burst | 30 | The allowance for immediate records without waiting for the periodic interval. |
Periodic recording
While a channel value changes, it is recorded at the interval set by min_interval. All messages received during an interval are combined into one record containing the minimum, maximum and mean.
The interval starts at the last record for that channel, rather than a common time for the group. Records for different channels are therefore not synchronized.
Reference points
Unchanged values are recorded less frequently, at the interval set by min_unchanged_interval. These reference points show that the channel was operating and its value remained unchanged.
Reference points are written only while channel messages continue to arrive. If a device stops publishing, no new records are added.
Burst records
Burst records capture channels that change infrequently but in short sequences, such as a door sensor with several transitions within a few seconds. Periodic recording alone would combine that sequence into one record.
- While no messages arrive, the channel accumulates one immediate-record allowance per elapsed
min_interval, up tomax_burst. - An arriving message uses one allowance and is recorded immediately.
- After the allowance is exhausted, the channel returns to periodic recording.
Allowance accumulates only in complete silence: repeated messages with unchanged values do not replenish it. Each channel has its own allowance; the group setting defines the same maximum for each. Every record, including a burst record, restarts the interval, so the next periodic record is not written until at least one interval later.
Retention depth
- Set
valuesfirst. Combined with the recording interval, it determines the history depth: 10000 records at 120-second intervals provide approximately 14 days. - Then set
values_totalto keep the database from filling the controller's storage.
When either limit is exceeded, the oldest records are deleted.
Reading the graph
The solid coloured line shows mean values. The translucent region in the same colour is the delta range, showing the minimum and maximum values between database records.
For a rapidly changing signal, increasing the recording interval saves storage while the delta range preserves information about extrema. If you need more individual records, reduce min_interval for rapidly changing signals or increase max_burst for infrequent bursts.
- The database stores the mean, minimum and maximum for each recording interval.
- The displayed time range is divided into intervals whose number depends on screen resolution, and database records are grouped accordingly.
- If several database records fall into a display interval, their values are averaged for that interval.
Automation scripts
The Rules page contains a CodeMirror editor for creating, editing and deleting wb-rules scripts. It reports errors and highlights their position.
| Shortcut | Action |
|---|---|
| Ctrl + D | Multiple selection/editing |
| Ctrl + / | Comment or uncomment lines |
| Ctrl + [ | Decrease indentation |
| Ctrl + ] | Increase indentation |
| Ctrl + C | Copy |
| Ctrl + V | Paste |
| Ctrl + Z | Undo |
| Ctrl + Shift + Z | Redo |
| Ctrl + U | Undo the last selection change |
| Ctrl + I | Select between matching brackets; repeat to select the next enclosing level |
| Ctrl + Space | Show completion suggestions |
| Ctrl + Shift + Left | Select the word to the left |
| Ctrl + Shift + Right | Select the word to the right |
| Ctrl + Shift + K | Delete the line |
| Ctrl + Backspace | Delete the word fragment before the cursor |
| Ctrl + Delete | Delete the word fragment after the cursor |
Configuring the controller and connected devices
Wiren Board runs Linux, and almost all settings are stored in configuration files. Edit them over SSH or with the web configurator. Open Settings → Configs for the available configurations, including connected Modbus devices, KNX and Modbus RTU/TCP Slave gateways and other services.
Discovering Wiren Board devices on RS-485
Automatic bus scanning requires devices that support Fast Modbus. Scanning is unavailable in wb-2207 and earlier. Releases wb-2304 through wb-2404 provide it under Settings → Scan.
From wb-2407, scanning is integrated into device configuration rather than a separate scanner. Open Settings → Configs, open the serial-device driver configuration and use its device search/add function.
Event notifications
Configure event notifications by SMS or email, for example an SMS when a WB-MWAC alarm is triggered. The notification module also supports Telegram. Telegram notifications can alternatively be sent from a wb-rules script.
Firmware updates and diagnostic archives
You can update controller software through the web interface without Internet access using a computer and a previously downloaded FIT firmware image.
When requesting technical support for a controller problem, collect a diagnostic archive to help identify the cause. The archive contains information needed for diagnosis. There are two ways to collect it:
- Open Settings → System and locate Diagnostic collector. Click Collect diagnostic data, then Download.
- Connect by SSH and run
wb-diag-collect diag. The archive is saved in the current directory, usually/root; copy it to your computer.
Backup
If the backup section is missing, update the controller software. Because settings are stored in files on Debian Linux, you can also back them up with standard tools such as rsync.
Under Settings → System → Backup, three download options are available:
- Download rootfs archive — archives the root filesystem, excluding configuration data in
/mnt/datawhose symbolic links are in/etc. The archive can be hundreds of megabytes to several gigabytes. - Download configs — archives system configuration files,
wb-rulesscripts and modules, and supported integration configurations, including zigbee2mqtt. This compact archive is approximately 20 MB and is generally sufficient if no third-party software has been installed. - Download everything — archives configurations, installed software and other controller files. It is the largest option and includes third-party configuration not covered by the compact archive.
Restore backups manually: install the required software, then copy the saved configuration files and scripts back to the controller. Backups can also be created from the command line.
MQTT channels and system logs
Open Settings → MQTT Channels to inspect channels when diagnosing a fault or integrating with software such as Rapid SCADA or Home Assistant.
View Linux system logs with journalctl or under Settings → Logs.
Checking exposed ports and default passwords
The controller can detect common security configuration problems:
- Default SSH passwords on ports 22, 25, 23, 2222, 8022, 9002 and 9022.
- An exposed MQTT broker on standard port 1883.
- An exposed web interface on ports 80, 8080, 443 or the port used to open the controller interface.
If the controller is reachable from the Internet and a problem is detected, the web interface displays a warning.
How the check works
Opening the controller interface triggers a request to https://probe.wirenboard.com/. The service attempts connections using common ports and protocols. It checks the public source IP of the request and the IP used to open the controller; duplicate and local addresses are ignored.
The service returns any detected problems for display. After fixing them, refresh the interface with F5 to request another check. When no known problems exist, checks are limited to once per day to reduce server and network load. No message appears when no problem is found.
Limitations of the check
This is a check for common configuration mistakes, not a complete security scan. For example, SSH exposed on port 3000 is outside the tested list. The check also does not detect an unsecured Wi-Fi access point.
Mobile access
The web interface adapts to the screen size and can operate the automation system from a phone or tablet. Third-party applications, including MQTT Dash, Home Assistant and other supported clients, are an alternative.
Previous version
Wiren Board web interface 1.0 was replaced by version 2.0 in early 2021.